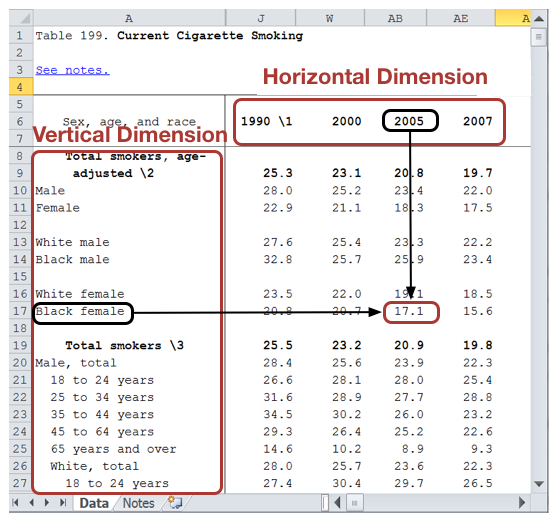
Example 1. 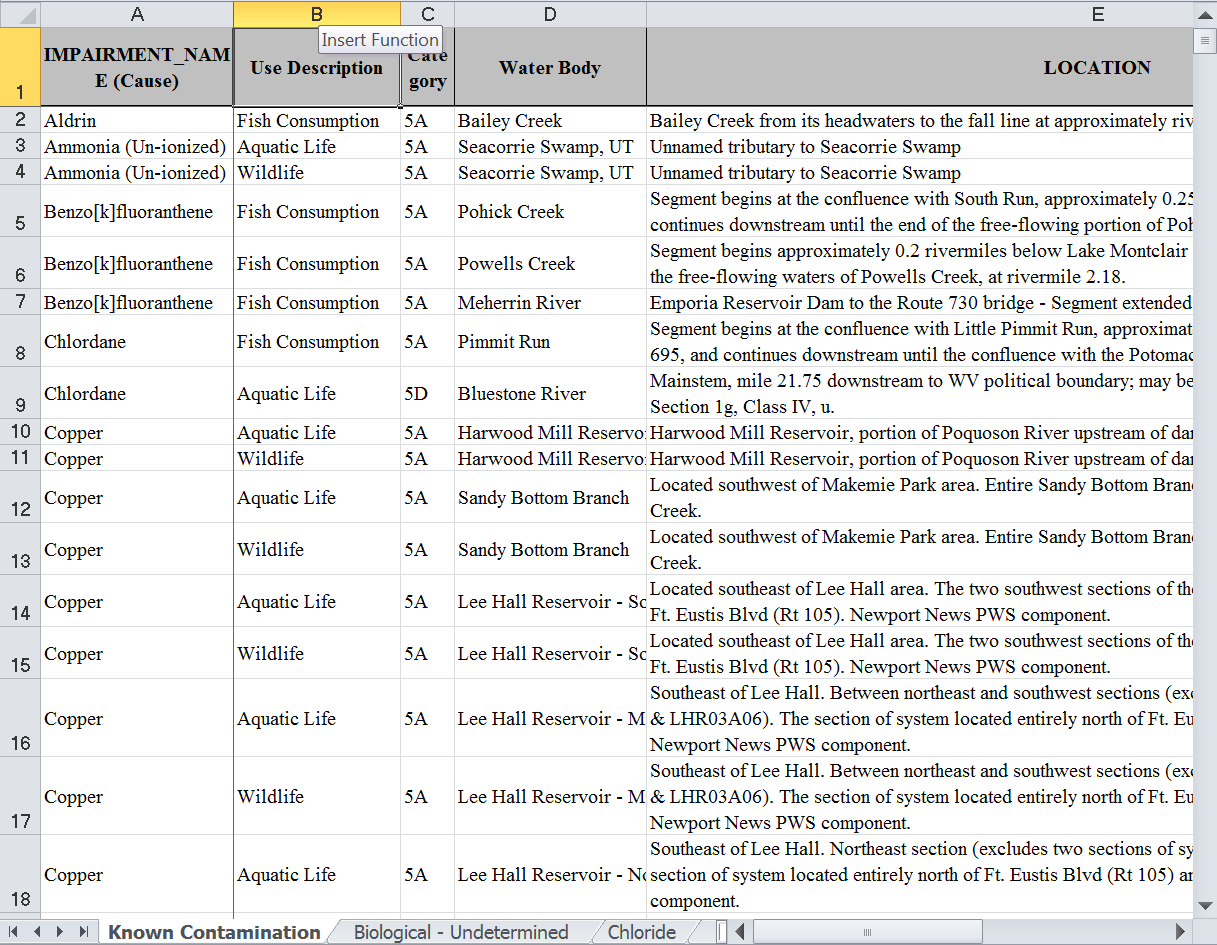
|
Please look at the spreadsheets on the left and try to answer the following
questions.
|
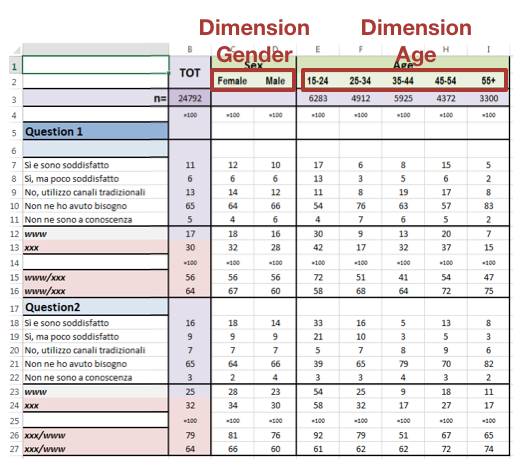
Example 2. 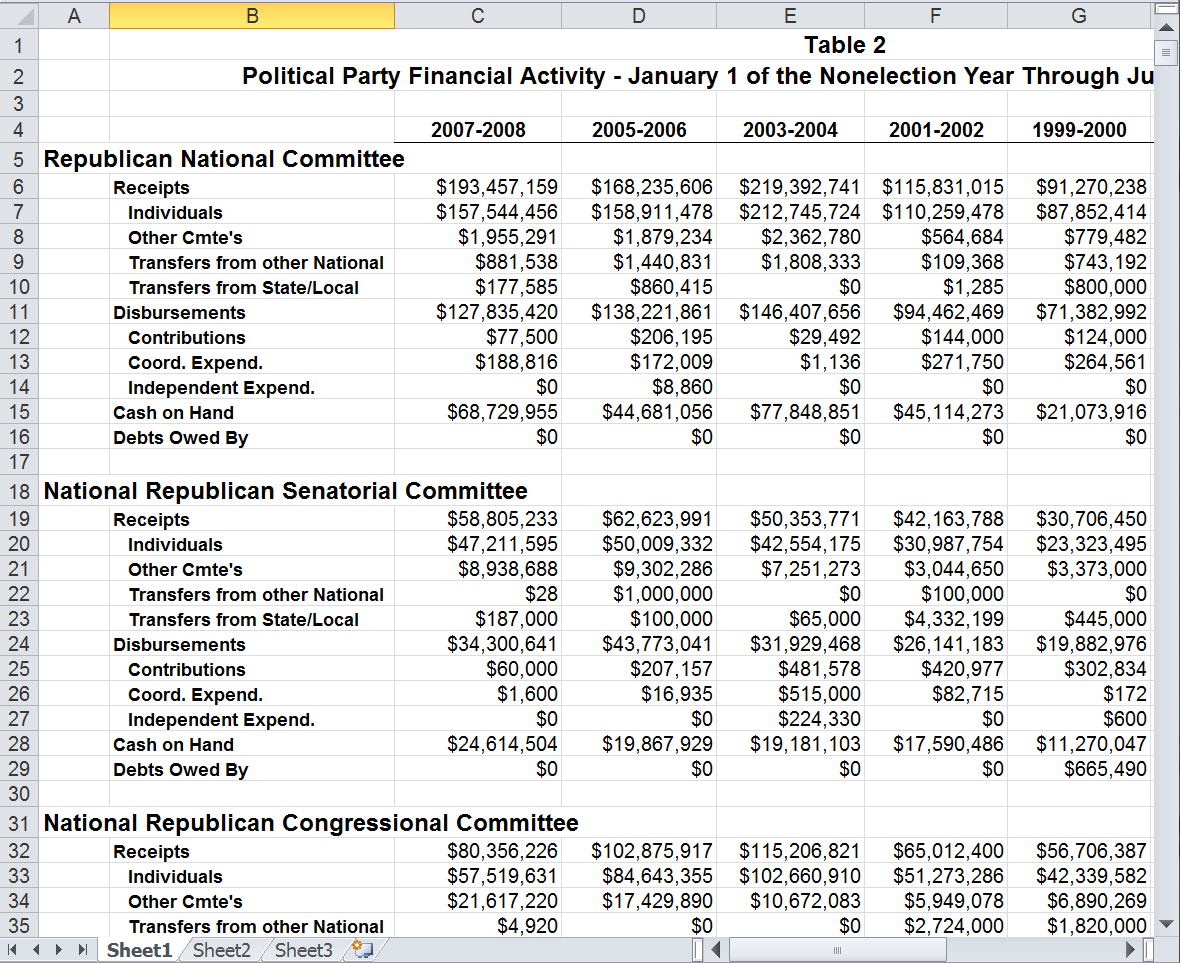
|
Please look at the spreadsheets on the left and try to answer the following
questions.
|
Example 3. 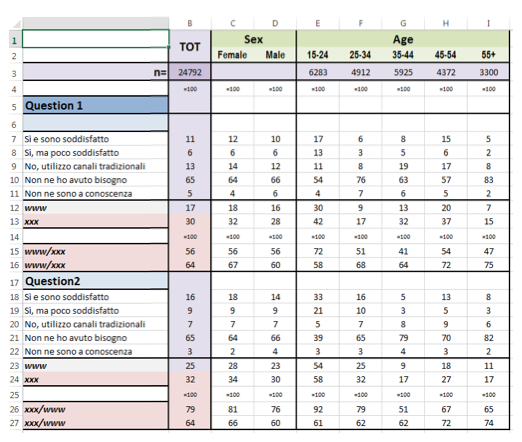
|
Please look at the spreadsheets on the left and try to answer the following
questions.
|